

On this page
- Plinko Rush at a glance
- Plinko Rush payout table: every row and risk setting
- Odds: how often each pocket hits
- Plinko Rush RTP: 96.00% on the studio page, 94.00–94.10% in the demo client
- Rows and risk: what each setting changes
- How to play Plinko Rush, step by step
- Which setting for which goal
- Plinko Rush vs Plinko GO, Turbo Plinko, BGaming Plinko and Spribe Plinko
- Sources and update history
- Plinko Rush FAQ
Short answer
Betsoft released Plinko Rush on : 8–16 rows (lines) and three risk settings make 27 combinations. The maximum is ×888 only on 16 rows at the highest risk, at 1 in 32,768 per ball; the 8-row maximum is ×27.
RTP is 96.00% on Betsoft’s game page and 94.00–94.10% in its demo-client tables. Rows determine pocket chances; risk changes multipliers. Every setting’s payouts appear below, with a free studio demo above.
Plinko Rush at a glance
Betsoft puts a ball above a triangle of pegs, with its finishing pocket deciding the payout. Press Bet to release a ball and let the board settle the round. Several balls can overlap.
Plinko Rush facts
- Studio
- Betsoft Gaming LTD
- Type
- Pegboard game
- Release date
- Rows
- 8–16
- Risk settings
- 3: Risk 1 · Risk 2 · Risk 3
- Volatility
- Low/High, Betsoft
- RTP, studio game page
- 96.00%
- RTP, studio demo-client tables
- 94.00–94.10%
- Maximum payout
- ×888, 16 rows, Risk 3
- Demo stake
- 0.10–100 EUR, 32 stake values
- Autoplay
- Yes, with number of rounds
- Demo
- Free Betsoft guest client
Is Plinko Rush a slot?
There are no reels, symbols or winning lines: the payout comes from a ball landing in a pocket. The board’s rows change its shape and pocket probabilities, rather than creating slot-style winning combinations. Betsoft’s Plinko games use the pegboard format instead of reel combinations.
Plinko Rush payout table: every row and risk setting
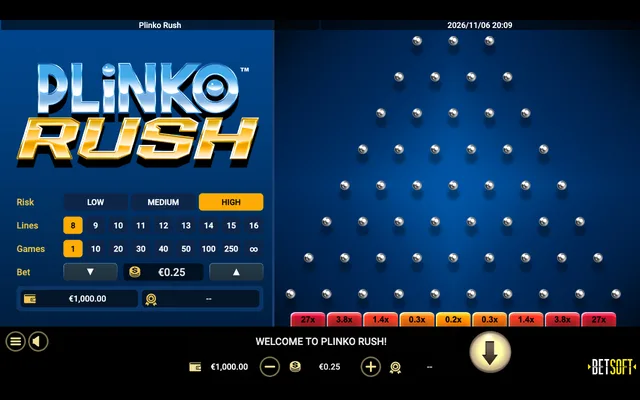
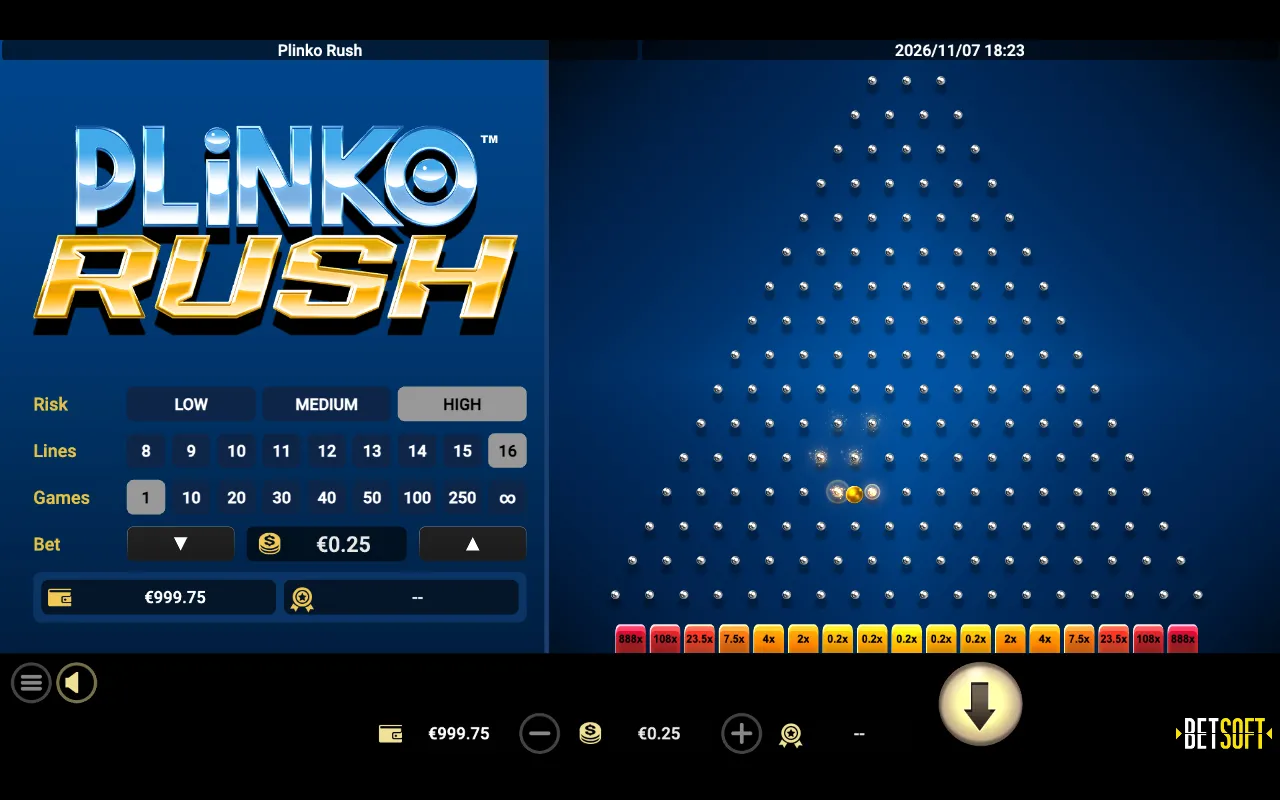
The payout is your stake multiplied by the finishing pocket’s multiplier, including returns below the stake. The edges pay more. On the widest board, Risk 3 stretches from ×888 at the edges to ×0.2 across the middle, while Risk 1 runs from ×15.5 to ×0.4.
Open a row count to compare every pocket across the risk settings, from the left edge to the right. Chance per ball is a decimal probability, or 1 in N for the rarest pockets; it is the same in every risk column.
8 rows: all pockets and risk settings
Betsoft demo client, captured . 8 rows; pockets numbered left to right.
| Chance per ball | Risk 1 | Risk 2 | Risk 3 | |
|---|---|---|---|---|
| 1 | 1 in 256 | ×2.8 | ×12.4 | ×27 |
| 2 | 1 in 32 | ×2.1 | ×3 | ×3.8 |
| 3 | 1 in 9 | ×1.1 | ×1.1 | ×1.4 |
| 4 | 1 in 5 | ×1 | ×0.7 | ×0.3 |
| 5 | 1 in 4 | ×0.4 | ×0.4 | ×0.2 |
| 6 | 1 in 5 | ×1 | ×0.7 | ×0.3 |
| 7 | 1 in 9 | ×1.1 | ×1.1 | ×1.4 |
| 8 | 1 in 32 | ×2.1 | ×3 | ×3.8 |
| 9 | 1 in 256 | ×2.8 | ×12.4 | ×27 |
9 rows: all pockets and risk settings
Betsoft demo client, captured . 9 rows; pockets numbered left to right.
| Chance per ball | Risk 1 | Risk 2 | Risk 3 | |
|---|---|---|---|---|
| 1 | 1 in 512 | ×3.2 | ×13.7 | ×42.8 |
| 2 | 1 in 57 | ×2.35 | ×3.9 | ×6.4 |
| 3 | 1 in 14 | ×1.4 | ×1.6 | ×1.8 |
| 4 | 1 in 6 | ×1 | ×1 | ×0.6 |
| 5 | 1 in 4 | ×0.65 | ×0.4 | ×0.2 |
| 6 | 1 in 4 | ×0.65 | ×0.4 | ×0.2 |
| 7 | 1 in 6 | ×1 | ×1 | ×0.6 |
| 8 | 1 in 14 | ×1.4 | ×1.6 | ×1.8 |
| 9 | 1 in 57 | ×2.35 | ×3.9 | ×6.4 |
| 10 | 1 in 512 | ×3.2 | ×13.7 | ×42.8 |
10 rows: all pockets and risk settings
Betsoft demo client, captured . 10 rows; pockets numbered left to right.
| Chance per ball | Risk 1 | Risk 2 | Risk 3 | |
|---|---|---|---|---|
| 1 | 1 in 1,024 | ×6.5 | ×20 | ×70 |
| 2 | 1 in 102 | ×2.4 | ×4.2 | ×10.3 |
| 3 | 1 in 23 | ×1.3 | ×2 | ×2.5 |
| 4 | 1 in 9 | ×1.1 | ×1.45 | ×0.9 |
| 5 | 1 in 5 | ×1 | ×0.5 | ×0.3 |
| 6 | 1 in 4 | ×0.4 | ×0.4 | ×0.2 |
| 7 | 1 in 5 | ×1 | ×0.5 | ×0.3 |
| 8 | 1 in 9 | ×1.1 | ×1.45 | ×0.9 |
| 9 | 1 in 23 | ×1.3 | ×2 | ×2.5 |
| 10 | 1 in 102 | ×2.4 | ×4.2 | ×10.3 |
| 11 | 1 in 1,024 | ×6.5 | ×20 | ×70 |
11 rows: all pockets and risk settings
Betsoft demo client, captured . 11 rows; pockets numbered left to right.
| Chance per ball | Risk 1 | Risk 2 | Risk 3 | |
|---|---|---|---|---|
| 1 | 1 in 2,048 | ×8 | ×24 | ×108 |
| 2 | 1 in 186 | ×3.1 | ×5.9 | ×13.8 |
| 3 | 1 in 37 | ×2.1 | ×3 | ×4.5 |
| 4 | 1 in 12 | ×1.2 | ×1.7 | ×1.4 |
| 5 | 1 in 6 | ×1 | ×0.6 | ×0.4 |
| 6 | 1 in 4 | ×0.6 | ×0.5 | ×0.2 |
| 7 | 1 in 4 | ×0.6 | ×0.5 | ×0.2 |
| 8 | 1 in 6 | ×1 | ×0.6 | ×0.4 |
| 9 | 1 in 12 | ×1.2 | ×1.7 | ×1.4 |
| 10 | 1 in 37 | ×2.1 | ×3 | ×4.5 |
| 11 | 1 in 186 | ×3.1 | ×5.9 | ×13.8 |
| 12 | 1 in 2,048 | ×8 | ×24 | ×108 |
12 rows: all pockets and risk settings
Betsoft demo client, captured . 12 rows; pockets numbered left to right.
| Chance per ball | Risk 1 | Risk 2 | Risk 3 | |
|---|---|---|---|---|
| 1 | 1 in 4,096 | ×8.5 | ×30 | ×150 |
| 2 | 1 in 341 | ×2.8 | ×12 | ×20.4 |
| 3 | 1 in 62 | ×1.5 | ×4.2 | ×7.5 |
| 4 | 1 in 19 | ×1.2 | ×1.8 | ×2 |
| 5 | 1 in 8 | ×1.1 | ×1.1 | ×0.7 |
| 6 | 1 in 5 | ×1 | ×0.5 | ×0.2 |
| 7 | 1 in 4 | ×0.4 | ×0.3 | ×0.2 |
| 8 | 1 in 5 | ×1 | ×0.5 | ×0.2 |
| 9 | 1 in 8 | ×1.1 | ×1.1 | ×0.7 |
| 10 | 1 in 19 | ×1.2 | ×1.8 | ×2 |
| 11 | 1 in 62 | ×1.5 | ×4.2 | ×7.5 |
| 12 | 1 in 341 | ×2.8 | ×12 | ×20.4 |
| 13 | 1 in 4,096 | ×8.5 | ×30 | ×150 |
13 rows: all pockets and risk settings
Betsoft demo client, captured . 13 rows; pockets numbered left to right.
| Chance per ball | Risk 1 | Risk 2 | Risk 3 | |
|---|---|---|---|---|
| 1 | 1 in 8,192 | ×8.8 | ×40 | ×240 |
| 2 | 1 in 630 | ×4.2 | ×11 | ×34.6 |
| 3 | 1 in 105 | ×3.1 | ×6 | ×9 |
| 4 | 1 in 29 | ×2 | ×3.1 | ×4 |
| 5 | 1 in 11 | ×1.1 | ×1.2 | ×1 |
| 6 | 1 in 6 | ×0.9 | ×0.6 | ×0.2 |
| 7 | 1 in 5 | ×0.6 | ×0.4 | ×0.2 |
| 8 | 1 in 5 | ×0.6 | ×0.4 | ×0.2 |
| 9 | 1 in 6 | ×0.9 | ×0.6 | ×0.2 |
| 10 | 1 in 11 | ×1.1 | ×1.2 | ×1 |
| 11 | 1 in 29 | ×2 | ×3.1 | ×4 |
| 12 | 1 in 105 | ×3.1 | ×6 | ×9 |
| 13 | 1 in 630 | ×4.2 | ×11 | ×34.6 |
| 14 | 1 in 8,192 | ×8.8 | ×40 | ×240 |
14 rows: all pockets and risk settings
Betsoft demo client, captured . 14 rows; pockets numbered left to right.
| Chance per ball | Risk 1 | Risk 2 | Risk 3 | |
|---|---|---|---|---|
| 1 | 1 in 16,384 | ×8 | ×58 | ×400 |
| 2 | 1 in 1,170 | ×2.2 | ×14 | ×55 |
| 3 | 1 in 180 | ×1.3 | ×7.1 | ×15.8 |
| 4 | 1 in 45 | ×1.25 | ×4 | ×4.8 |
| 5 | 1 in 16 | ×1.2 | ×1.5 | ×1.8 |
| 6 | 1 in 8 | ×1.1 | ×1 | ×0.3 |
| 7 | 1 in 5 | ×1 | ×0.5 | ×0.2 |
| 8 | 1 in 5 | ×0.4 | ×0.2 | ×0.2 |
| 9 | 1 in 5 | ×1 | ×0.5 | ×0.2 |
| 10 | 1 in 8 | ×1.1 | ×1 | ×0.3 |
| 11 | 1 in 16 | ×1.2 | ×1.5 | ×1.8 |
| 12 | 1 in 45 | ×1.25 | ×4 | ×4.8 |
| 13 | 1 in 180 | ×1.3 | ×7.1 | ×15.8 |
| 14 | 1 in 1,170 | ×2.2 | ×14 | ×55 |
| 15 | 1 in 16,384 | ×8 | ×58 | ×400 |
15 rows: all pockets and risk settings
Betsoft demo client, captured . 15 rows; pockets numbered left to right.
| Chance per ball | Risk 1 | Risk 2 | Risk 3 | |
|---|---|---|---|---|
| 1 | 1 in 32,768 | ×15 | ×88 | ×620 |
| 2 | 1 in 2,185 | ×8 | ×20 | ×80 |
| 3 | 1 in 312 | ×2.7 | ×10 | ×24 |
| 4 | 1 in 72 | ×2 | ×5 | ×7 |
| 5 | 1 in 24 | ×1.4 | ×2.9 | ×3 |
| 6 | 1 in 11 | ×1.1 | ×1.1 | ×0.5 |
| 7 | 1 in 7 | ×1 | ×0.5 | ×0.2 |
| 8 | 1 in 5 | ×0.6 | ×0.3 | ×0.2 |
| 9 | 1 in 5 | ×0.6 | ×0.3 | ×0.2 |
| 10 | 1 in 7 | ×1 | ×0.5 | ×0.2 |
| 11 | 1 in 11 | ×1.1 | ×1.1 | ×0.5 |
| 12 | 1 in 24 | ×1.4 | ×2.9 | ×3 |
| 13 | 1 in 72 | ×2 | ×5 | ×7 |
| 14 | 1 in 312 | ×2.7 | ×10 | ×24 |
| 15 | 1 in 2,185 | ×8 | ×20 | ×80 |
| 16 | 1 in 32,768 | ×15 | ×88 | ×620 |
16 rows: all pockets and risk settings
Betsoft demo client, captured . 16 rows; pockets numbered left to right.
| Chance per ball | Risk 1 | Risk 2 | Risk 3 | |
|---|---|---|---|---|
| 1 | 1 in 65,536 | ×15.5 | ×108 | ×888 |
| 2 | 1 in 4,096 | ×7 | ×30 | ×108 |
| 3 | 1 in 546 | ×1.8 | ×8.2 | ×23.5 |
| 4 | 1 in 117 | ×1.2 | ×5 | ×7.5 |
| 5 | 1 in 36 | ×1.2 | ×2.8 | ×4 |
| 6 | 1 in 15 | ×1.1 | ×1.3 | ×2 |
| 7 | 1 in 8 | ×1.1 | ×1 | ×0.2 |
| 8 | 1 in 6 | ×1 | ×0.5 | ×0.2 |
| 9 | 1 in 5 | ×0.4 | ×0.3 | ×0.2 |
| 10 | 1 in 6 | ×1 | ×0.5 | ×0.2 |
| 11 | 1 in 8 | ×1.1 | ×1 | ×0.2 |
| 12 | 1 in 15 | ×1.1 | ×1.3 | ×2 |
| 13 | 1 in 36 | ×1.2 | ×2.8 | ×4 |
| 14 | 1 in 117 | ×1.2 | ×5 | ×7.5 |
| 15 | 1 in 546 | ×1.8 | ×8.2 | ×23.5 |
| 16 | 1 in 4,096 | ×7 | ×30 | ×108 |
| 17 | 1 in 65,536 | ×15.5 | ×108 | ×888 |
At 16 rows on Risk 3, 79.0% of balls return less than the stake. The larger edge multiplier comes with a broad band of small returns; the outcome probabilities distinguish a paying pocket from a profitable ball.
×27 and ×888: two maxima, one game
The smaller headline belongs to the 8-row board at the highest risk, while the larger one belongs to the 16-row board at that same risk setting. Both describe Plinko Rush. A maximum without its row count leaves out the setting that makes it possible.
Odds: how often each pocket hits
A pocket’s chance is C(n,k)/2ⁿ, where n is the number of rows and k its position counted from zero. Risk leaves those chances unchanged. On 16 rows the central pocket takes 19.6% of balls (12,870 / 65,536), while a particular edge pocket takes 1 in 65,536.
16-row pocket probabilities, left edge to right edge
The widest segment is the centre pocket; the narrowest segments are the edges.
Hit rate by setting
A return above the stake is a profitable ball; an equal return gives the stake back. The share above the stake runs from 9.2% on 13 rows at Risk 3 to 45.4% on 16 rows at Risk 1. Filter by rows to compare the risk settings on the same board.
Calculated from the studio table. Outcome shares are percentages of balls; SD is standard deviation per ball in stake units. Top chance combines both edge pockets.
| Rows | Risk | RTP | SD | Above stake | Stake back | Below stake | Stake back or more | Top | Top: 1 in |
|---|---|---|---|---|---|---|---|---|---|
| 8 | Risk 1 | 94.06% | 0.45 | 28.9% | 43.8% | 27.3% | 72.7% | ×2.8 | 128 |
| 8 | Risk 2 | 94.06% | 1.18 | 28.9% | 0.0% | 71.1% | 28.9% | ×12.4 | 128 |
| 8 | Risk 3 | 94.06% | 2.49 | 28.9% | 0.0% | 71.1% | 28.9% | ×27 | 128 |
| 9 | Risk 1 | 94.00% | 0.40 | 18.0% | 32.8% | 49.2% | 50.8% | ×3.2 | 256 |
| 9 | Risk 2 | 94.06% | 1.07 | 18.0% | 32.8% | 49.2% | 50.8% | ×13.7 | 256 |
| 9 | Risk 3 | 94.06% | 2.88 | 18.0% | 0.0% | 82.0% | 18.0% | ×42.8 | 256 |
| 10 | Risk 1 | 94.02% | 0.44 | 34.4% | 41.0% | 24.6% | 75.4% | ×6.5 | 512 |
| 10 | Risk 2 | 94.02% | 1.11 | 34.4% | 0.0% | 65.6% | 34.4% | ×20 | 512 |
| 10 | Risk 3 | 94.08% | 3.40 | 10.9% | 0.0% | 89.1% | 10.9% | ×70 | 512 |
| 11 | Risk 1 | 94.02% | 0.49 | 22.7% | 32.2% | 45.1% | 54.9% | ×8 | 1,024 |
| 11 | Risk 2 | 94.08% | 1.11 | 22.7% | 0.0% | 77.3% | 22.7% | ×24 | 1,024 |
| 11 | Risk 3 | 94.01% | 3.75 | 22.7% | 0.0% | 77.3% | 22.7% | ×108 | 1,024 |
| 12 | Risk 1 | 94.06% | 0.37 | 38.8% | 38.7% | 22.6% | 77.4% | ×8.5 | 2,048 |
| 12 | Risk 2 | 94.06% | 1.31 | 38.8% | 0.0% | 61.2% | 38.8% | ×30 | 2,048 |
| 12 | Risk 3 | 94.10% | 3.86 | 14.6% | 0.0% | 85.4% | 14.6% | ×150 | 2,048 |
| 13 | Risk 1 | 94.03% | 0.52 | 26.7% | 0.0% | 73.3% | 26.7% | ×8.8 | 4,096 |
| 13 | Risk 2 | 94.10% | 1.30 | 26.7% | 0.0% | 73.3% | 26.7% | ×40 | 4,096 |
| 13 | Risk 3 | 94.03% | 4.45 | 9.2% | 17.5% | 73.3% | 26.7% | ×240 | 4,096 |
| 14 | Risk 1 | 94.05% | 0.30 | 42.4% | 36.7% | 20.9% | 79.1% | ×8 | 8,192 |
| 14 | Risk 2 | 94.05% | 1.32 | 18.0% | 24.4% | 57.6% | 42.4% | ×58 | 8,192 |
| 14 | Risk 3 | 94.01% | 5.30 | 18.0% | 0.0% | 82.0% | 18.0% | ×400 | 8,192 |
| 15 | Risk 1 | 94.05% | 0.42 | 30.2% | 30.5% | 39.3% | 60.7% | ×15 | 16,384 |
| 15 | Risk 2 | 94.04% | 1.52 | 30.2% | 0.0% | 69.8% | 30.2% | ×88 | 16,384 |
| 15 | Risk 3 | 94.05% | 5.86 | 11.8% | 0.0% | 88.2% | 11.8% | ×620 | 16,384 |
| 16 | Risk 1 | 94.08% | 0.32 | 45.4% | 34.9% | 19.6% | 80.4% | ×15.5 | 32,768 |
| 16 | Risk 2 | 94.01% | 1.26 | 21.0% | 24.4% | 54.6% | 45.4% | ×108 | 32,768 |
| 16 | Risk 3 | 94.08% | 5.77 | 21.0% | 0.0% | 79.0% | 21.0% | ×888 | 32,768 |
The same pocket odds produce different hit rates because risk moves multipliers above or below the stake. A frequent return below the stake still reduces the balance, a distinction that matters when learning how Plinko payouts work.
How often does ×888 land?
The maximum occupies both edges of the widest board at the highest risk. Together they give a 1 in 32,768 chance per ball; 22,713 balls give a 50% chance of seeing that maximum at least once. That is a probability across a run, never a deadline for a winning ball.
For the maximum on the 8-row and 12-row boards, the corresponding counts for an even chance are 88 and 1,419 balls. BGaming Plinko shares these pocket probabilities, although its multipliers differ. More drops create more chances to reach an edge, with a stake attached to each drop.
Plinko Rush RTP: 96.00% on the studio page, 94.00–94.10% in the demo client
Betsoft’s game page gives one return, while its demo-client payout and chance tables give another across every setting. Both are studio figures. The table below turns that difference into an expected cost for the same total amount wagered, rather than treating either figure as a promise for a session.
Expected cost: arithmetic from the studio figures. Units refer to total stakes, not a required currency.
| Betsoft source | RTP | Expected cost per 100 units staked |
|---|---|---|
| Game page | 96.00% | 4 units |
| Demo-client tables, all 27 settings | 94.00–94.10% | 5.90–6.00 units |
The client’s lowest return belongs to 9 rows at Risk 1; its highest belongs to 12 rows at Risk 3 and 13 rows at Risk 2. Each cell below carries that setting’s return, calculated from the studio table by summing chance multiplied by payout across its pockets.
| Rows | Risk 1 | Risk 2 | Risk 3 |
|---|---|---|---|
| 8 | 94.06% | 94.06% | 94.06% |
| 9 | 94.00% | 94.06% | 94.06% |
| 10 | 94.02% | 94.02% | 94.08% |
| 11 | 94.02% | 94.08% | 94.01% |
| 12 | 94.06% | 94.06% | 94.10% |
| 13 | 94.03% | 94.10% | 94.03% |
| 14 | 94.05% | 94.05% | 94.01% |
| 15 | 94.05% | 94.04% | 94.05% |
| 16 | 94.08% | 94.01% | 94.08% |
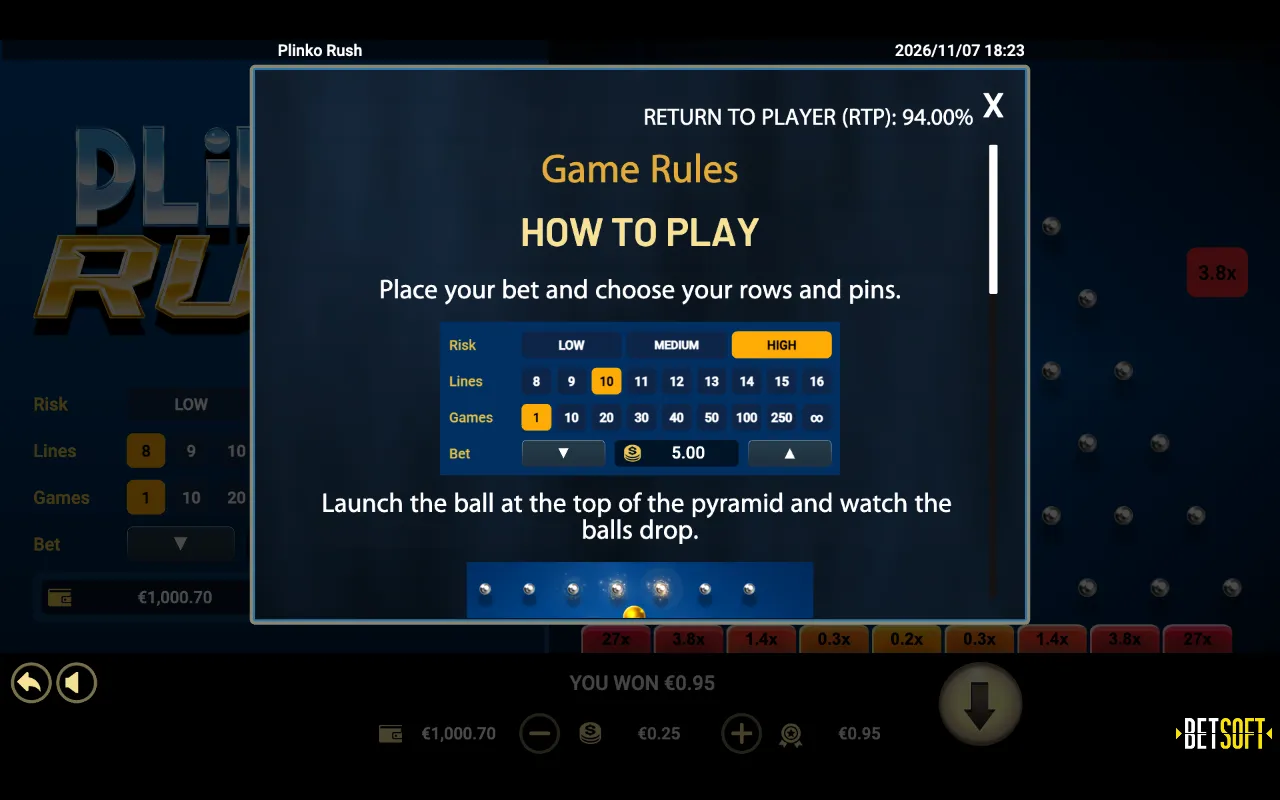
The meaning of RTP stays the same in either case: a long-run return across wagers, rather than the amount a particular balance will retain. Changing risk redistributes the payouts without resolving the difference between Betsoft’s two figures.
Rows and risk: what each setting changes
Rows move the pocket probabilities; risk moves the payouts attached to those pockets. A wider board makes either edge rarer, while a different risk setting changes what landing there is worth. Risk never makes edges likelier.
Standard deviation measures the spread of a ball’s return in stake units. A larger value means more widely separated outcomes, rather than a larger average return. The narrowest board has the following spread and top payouts:
8 rows: spread and maximum payout, calculated from the studio table.
| Setting | SD per ball | Top multiplier |
|---|---|---|
| Risk 1 | 0.45 | ×2.8 |
| Risk 2 | 1.18 | ×12.4 |
| Risk 3 | 2.49 | ×27 |
The demo-client return varies by no more than 0.10 percentage points between settings, so the sizeable change is in the shape of the outcomes. On the widest board, Risk 2 and Risk 3 beat the stake equally often, but only the middle setting retains a band that returns the stake exactly.
Choose the row count first when the frequency of edge hits matters to you, then use risk to choose their value. The centre remains the most likely part of the board, so changing its payouts affects the results you encounter most often.
How to play Plinko Rush, step by step
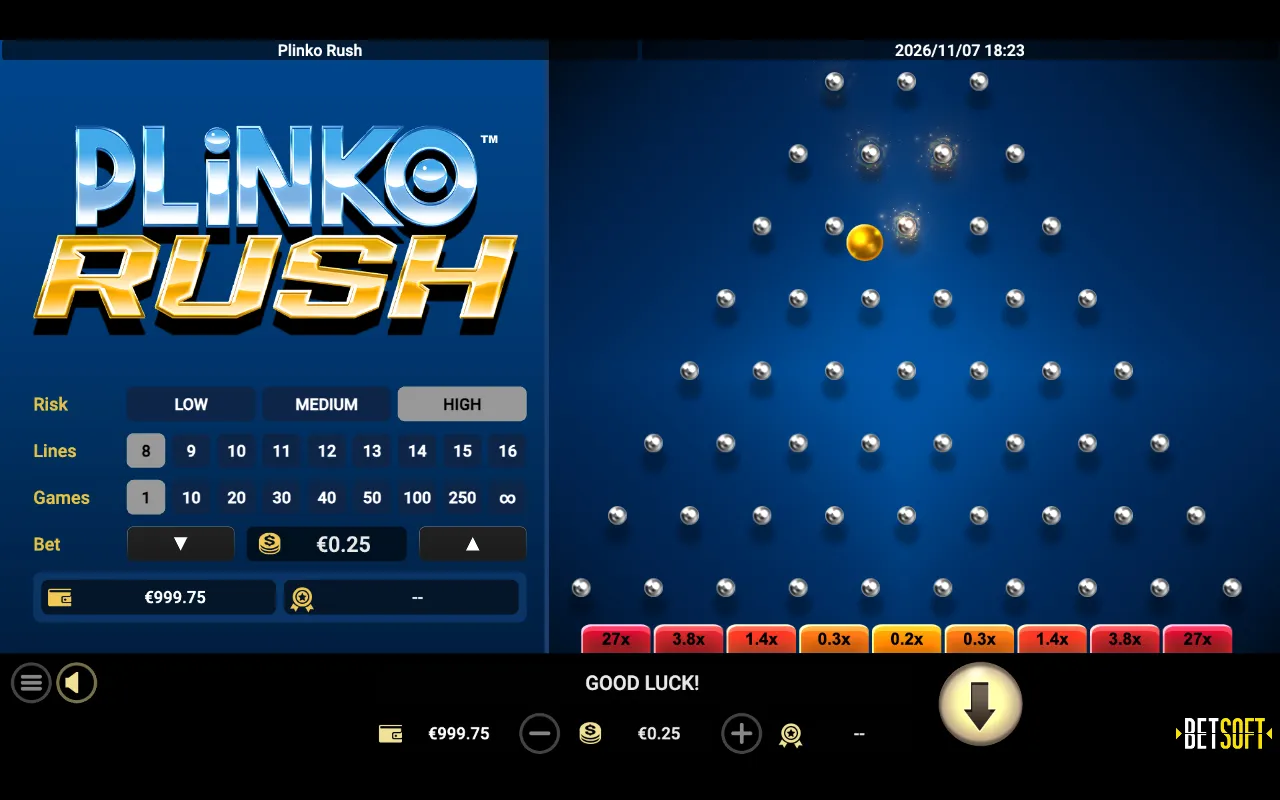
A round starts with your stake and board settings, then ends with the ball’s finishing pocket. Bet drops one ball. Set the board before pressing it, because the row count and risk together define the payout table for that round.
Choose the stake
Select the amount for the ball. Keep the stake decision separate from the multiplier you hope to reach.
Choose the row count
Set the board from 8 to 16 rows. This changes the chances attached to its pockets.
Choose the risk setting
Select the lowest, middle or highest risk setting. The same pockets now carry that setting’s multipliers.
Press Bet
A single ball drops through the pegs. Its destination decides which multiplier applies to the stake.
Read the payout
Multiply the stake by the finishing pocket’s value. A payout below the stake is a losing result even though it returns part of the amount wagered.
That sequence is the same for a manual drop each time: settings first, then the ball and its result. A busier board comes from sending further balls while earlier ones are still in play.
Several balls at once
Each press of Bet releases a ball, and several can travel through the board simultaneously. The overlap changes the pace of play; each ball still has its own stake and finishing-pocket payout.
Autoplay and rounds
Autoplay uses a selected number of rounds to repeat play. Choose that count as part of the amount you intend to wager, since repeated drops keep applying the selected board’s payout structure rather than changing its return.
Bet size and currency
The studio demo uses EUR with its stake range and full ladder below. Casino stakes and currency are set by the casino, so the demo’s values describe free play rather than a universal cash-game limit.
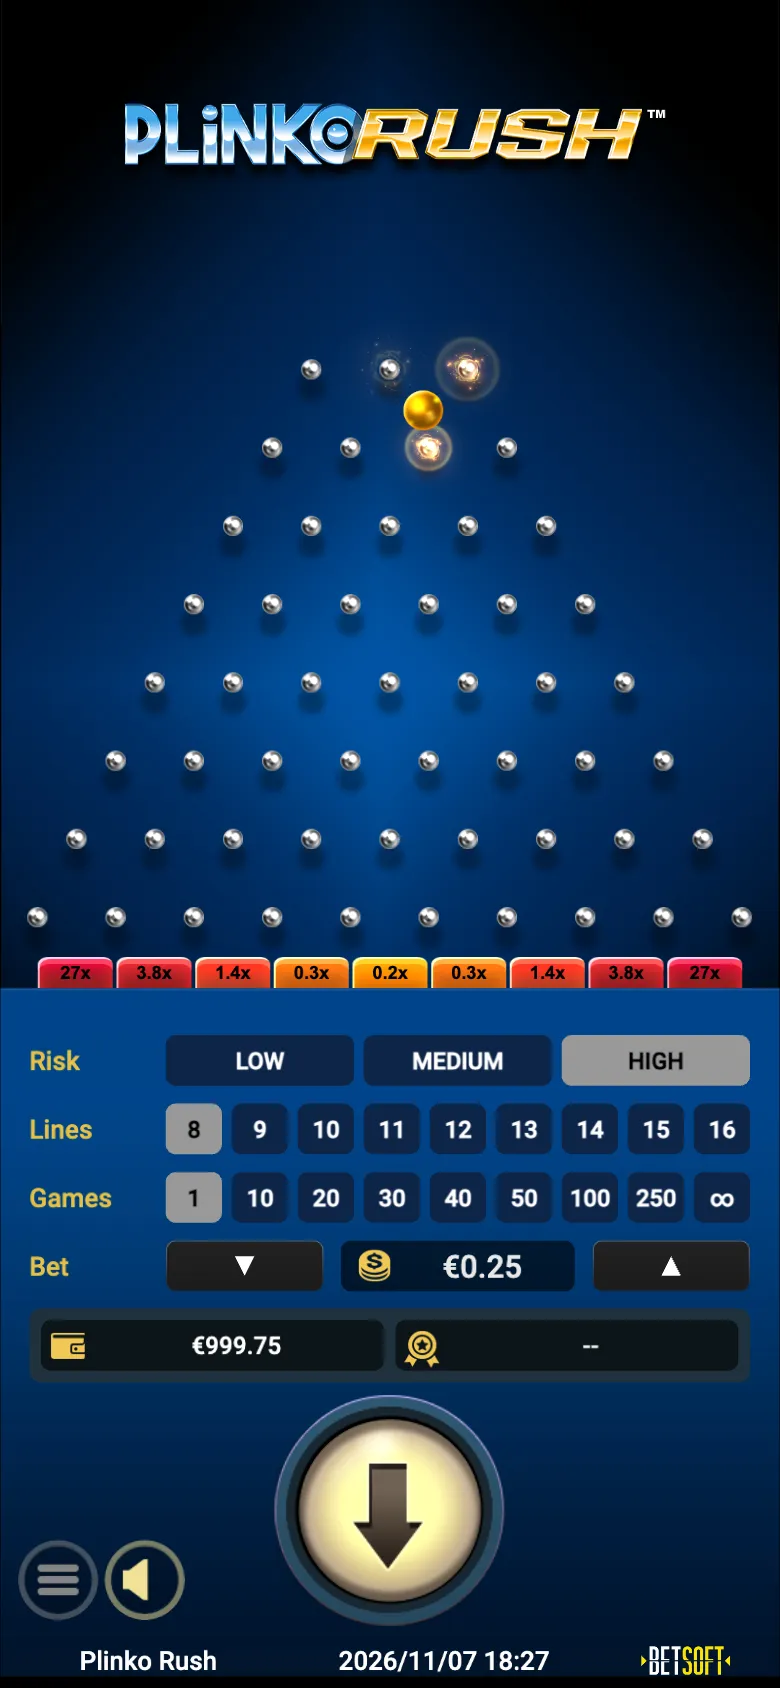
Betsoft demo stake ladder, EUR.
| Demo stakes |
|---|
| 0.10, 0.15, 0.25, 0.35, 0.50, 0.65, 0.75, 0.80, 1.20, 1.30, 1.50, 1.80, 2.20, 2.40, 3.00, 3.20, 3.75, 4.50, 6.00, 6.50, 7.50, 9.00, 12.00, 13.00, 15.00, 20.00, 30.00, 40.00, 60.00, 75.00, 90.00, 100.00 |
All those values change the amount paid by a pocket, while its probability stays fixed for the chosen rows. Understanding a payout relative to your stake makes the result clearer than counting every returning ball as a win.
Which setting for which goal
The smallest spread and the biggest multiplier belong to different boards, so choose the outcome pattern you want before starting. No setting guarantees a profit. Return barely changes between settings; the useful decision is how often money comes back and how far individual payouts spread around the average.
Settings matched to session goals; calculated from the studio table.
| Goal | Setting | What changes |
|---|---|---|
| Prefer smaller swings on a small stake | 14 rows, Risk 1 | Minimum SD: 0.30 stakes per ball |
| Get the stake back or more most often | 16 rows, Risk 1 | 45.4% above stake; 34.9% stake back; 19.6% below stake |
| Aim for the rarest large multiplier | 16 rows, Risk 3 | ×888, with a 1 in 32,768 chance per ball |
The smallest spread does not guarantee the longest session, and a frequent return of the stake is not a frequent profit. The first goal favours less variable results; the second favours recovery of the amount wagered, while the last accepts rare edge hits for their larger payouts.
A fixed stake keeps the cost of each drop clear as you compare those patterns. Planning a Plinko session starts with the amount wagered, because selecting a different risk leaves the board’s long-run return below the amount staked.
Plinko Rush vs Plinko GO, Turbo Plinko, BGaming Plinko and Spribe Plinko
Plinko Rush combines overlapping balls and autoplay with its adjustable board; neighbouring games add their own controls or features. Similar boards pay differently. The comparison keeps each game’s studio and return beside its maximum so a shared format does not imply a shared payout table.
Plinko Rush and neighbouring games.
| Game / studio | Release | RTP | Maximum | Rows / volatility / fairness | Features |
|---|---|---|---|---|---|
| Plinko Rush / Betsoft | 96.00% game page; 94.00–94.10% demo-client tables | ×888, 16 rows | 8–16 rows; Low/High | Several balls; autoplay | |
| Plinko GO / 1x2 Gaming | 96% / 94% / 92% | ×420 | Low, adjustable | Board size; speed; autoplay | |
| Turbo Plinko / Turbo Games | Up to 97% | ×1,000 | 8–16 rows; Low to Medium/High; Provably fair | Discs per drop | |
| Plinko / BGaming | 98.91–99.16%, demo | ×1,000 | 8–16 rows; Provably fair | Record table | |
| Plinko / Spribe | 97% | ×555 | 12 / 14 / 16 rows; Provably fair | Ball colour sets risk; autoplay |
Plinko GO puts board size beside speed and autoplay. It gives the player another way to shape the pace, while its return figures and maximum belong to its own tables rather than to Betsoft’s board.
Turbo Plinko includes a discs-per-drop choice, alongside its row range. That is a different feature from Plinko Rush’s ability to keep several individually released balls in play simultaneously.
BGaming Plinko has the same C(n,k)/2ⁿ pocket chances as Plinko Rush, with different multipliers and a different return. Matching the rows therefore matches the likelihood of a pocket, rather than the amount that pocket pays.
Spribe Plinko uses ball colour to represent risk and also offers autoplay. Plinko Rush is the one here that keeps several balls in play at once; the wider Plinko catalogue makes the differences between studios easier to compare.
 1x2 GamingPlinko GOBoard size and speed shape the pace alongside autoplay.
 Turbo GamesTurbo PlinkoA discs-per-drop choice changes how balls enter play.
 BGamingBGaming PlinkoMatching pocket chances lead to different payouts.
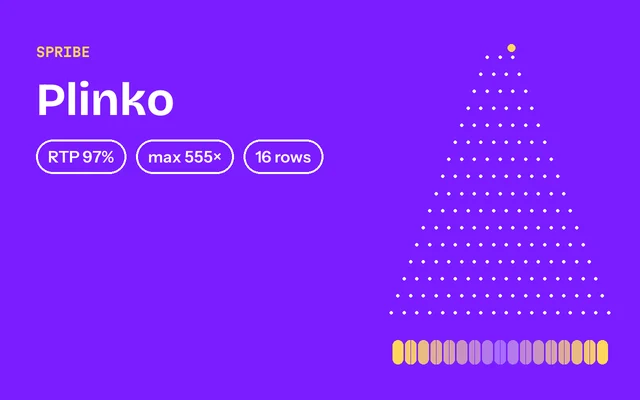 SpribeSpribe PlinkoBall colour represents the selected risk.
 BetsoftOlympus Plinko
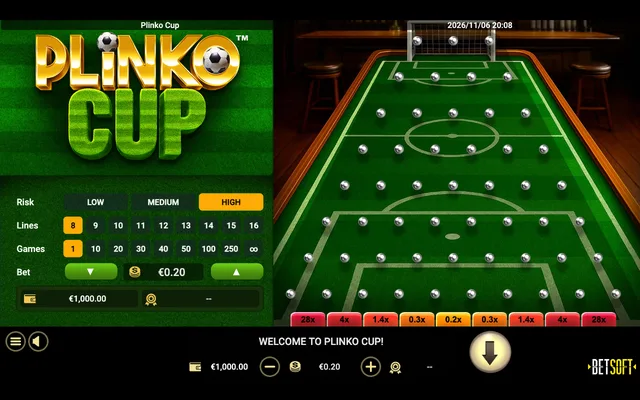 BetsoftPlinko Cup
Ball colour replaces row selection in InOut Games Plinko 1000, a different way to choose the board’s payout pattern.

Sources and update history
Betsoft supplies the payout and pocket-chance tables as well as the game-page return and mechanics. Pocket chances come from Betsoft. Standard deviation and outcome shares are calculated from the studio table; expected cost is arithmetic from the studio figures.
Plinko Rush references and dates.
| Source | Figures and features | Date |
|---|---|---|
| Betsoft demo client | Pocket multipliers and chances; return by setting; demo stake ladder | |
| Betsoft game page | Release date; game-page return; volatility; rows; simultaneous balls; autoplay | |
| FruitySlots review | 94% return reference | |
| VegasSlotsOnline review | ×27 maximum reference |
The studio tables distinguish the maximum for each board, so the smaller maximum in reviews and the widest board’s maximum can coexist.
Set play limits or use self-exclusion through responsible gaming.
Page history
- Added every studio payout and pocket chance, outcome rates for all settings, the two RTP figures, and settings by goal.
- RTP, rows and features taken from Betsoft’s game page; demo link added.
- 4 studio demo screenshots added beside the rows, risk or feature on screen.
18+ only. Casinos marked ¹ hold an offshore licence, what that means. Some links on this page earn us a commission from the casino; it does not change the price for you.